.svg)

Sales Compensation Dashboards Explained: Metrics, Use Cases, and Best Practices

Sales compensation dashboards make incentive pay transparent and performance-driven.
When reps can see commissions and quota progress in real time, they know which deals, thresholds, or accelerators will move their earnings and can prioritize the actions that get them there. RevOps and Finance can validate payouts faster and avoid seller disputes because they share the same live view of earnings and revenue.
Without dashboards, compensation data gets trapped in spreadsheets and static reports, slowing teams down and eroding trust.
This guide explains what a sales compensation dashboard is, which metrics matter most, and how to build dashboards that improve transparency, accuracy, and sales performance.
What Is a Sales Compensation Dashboard?
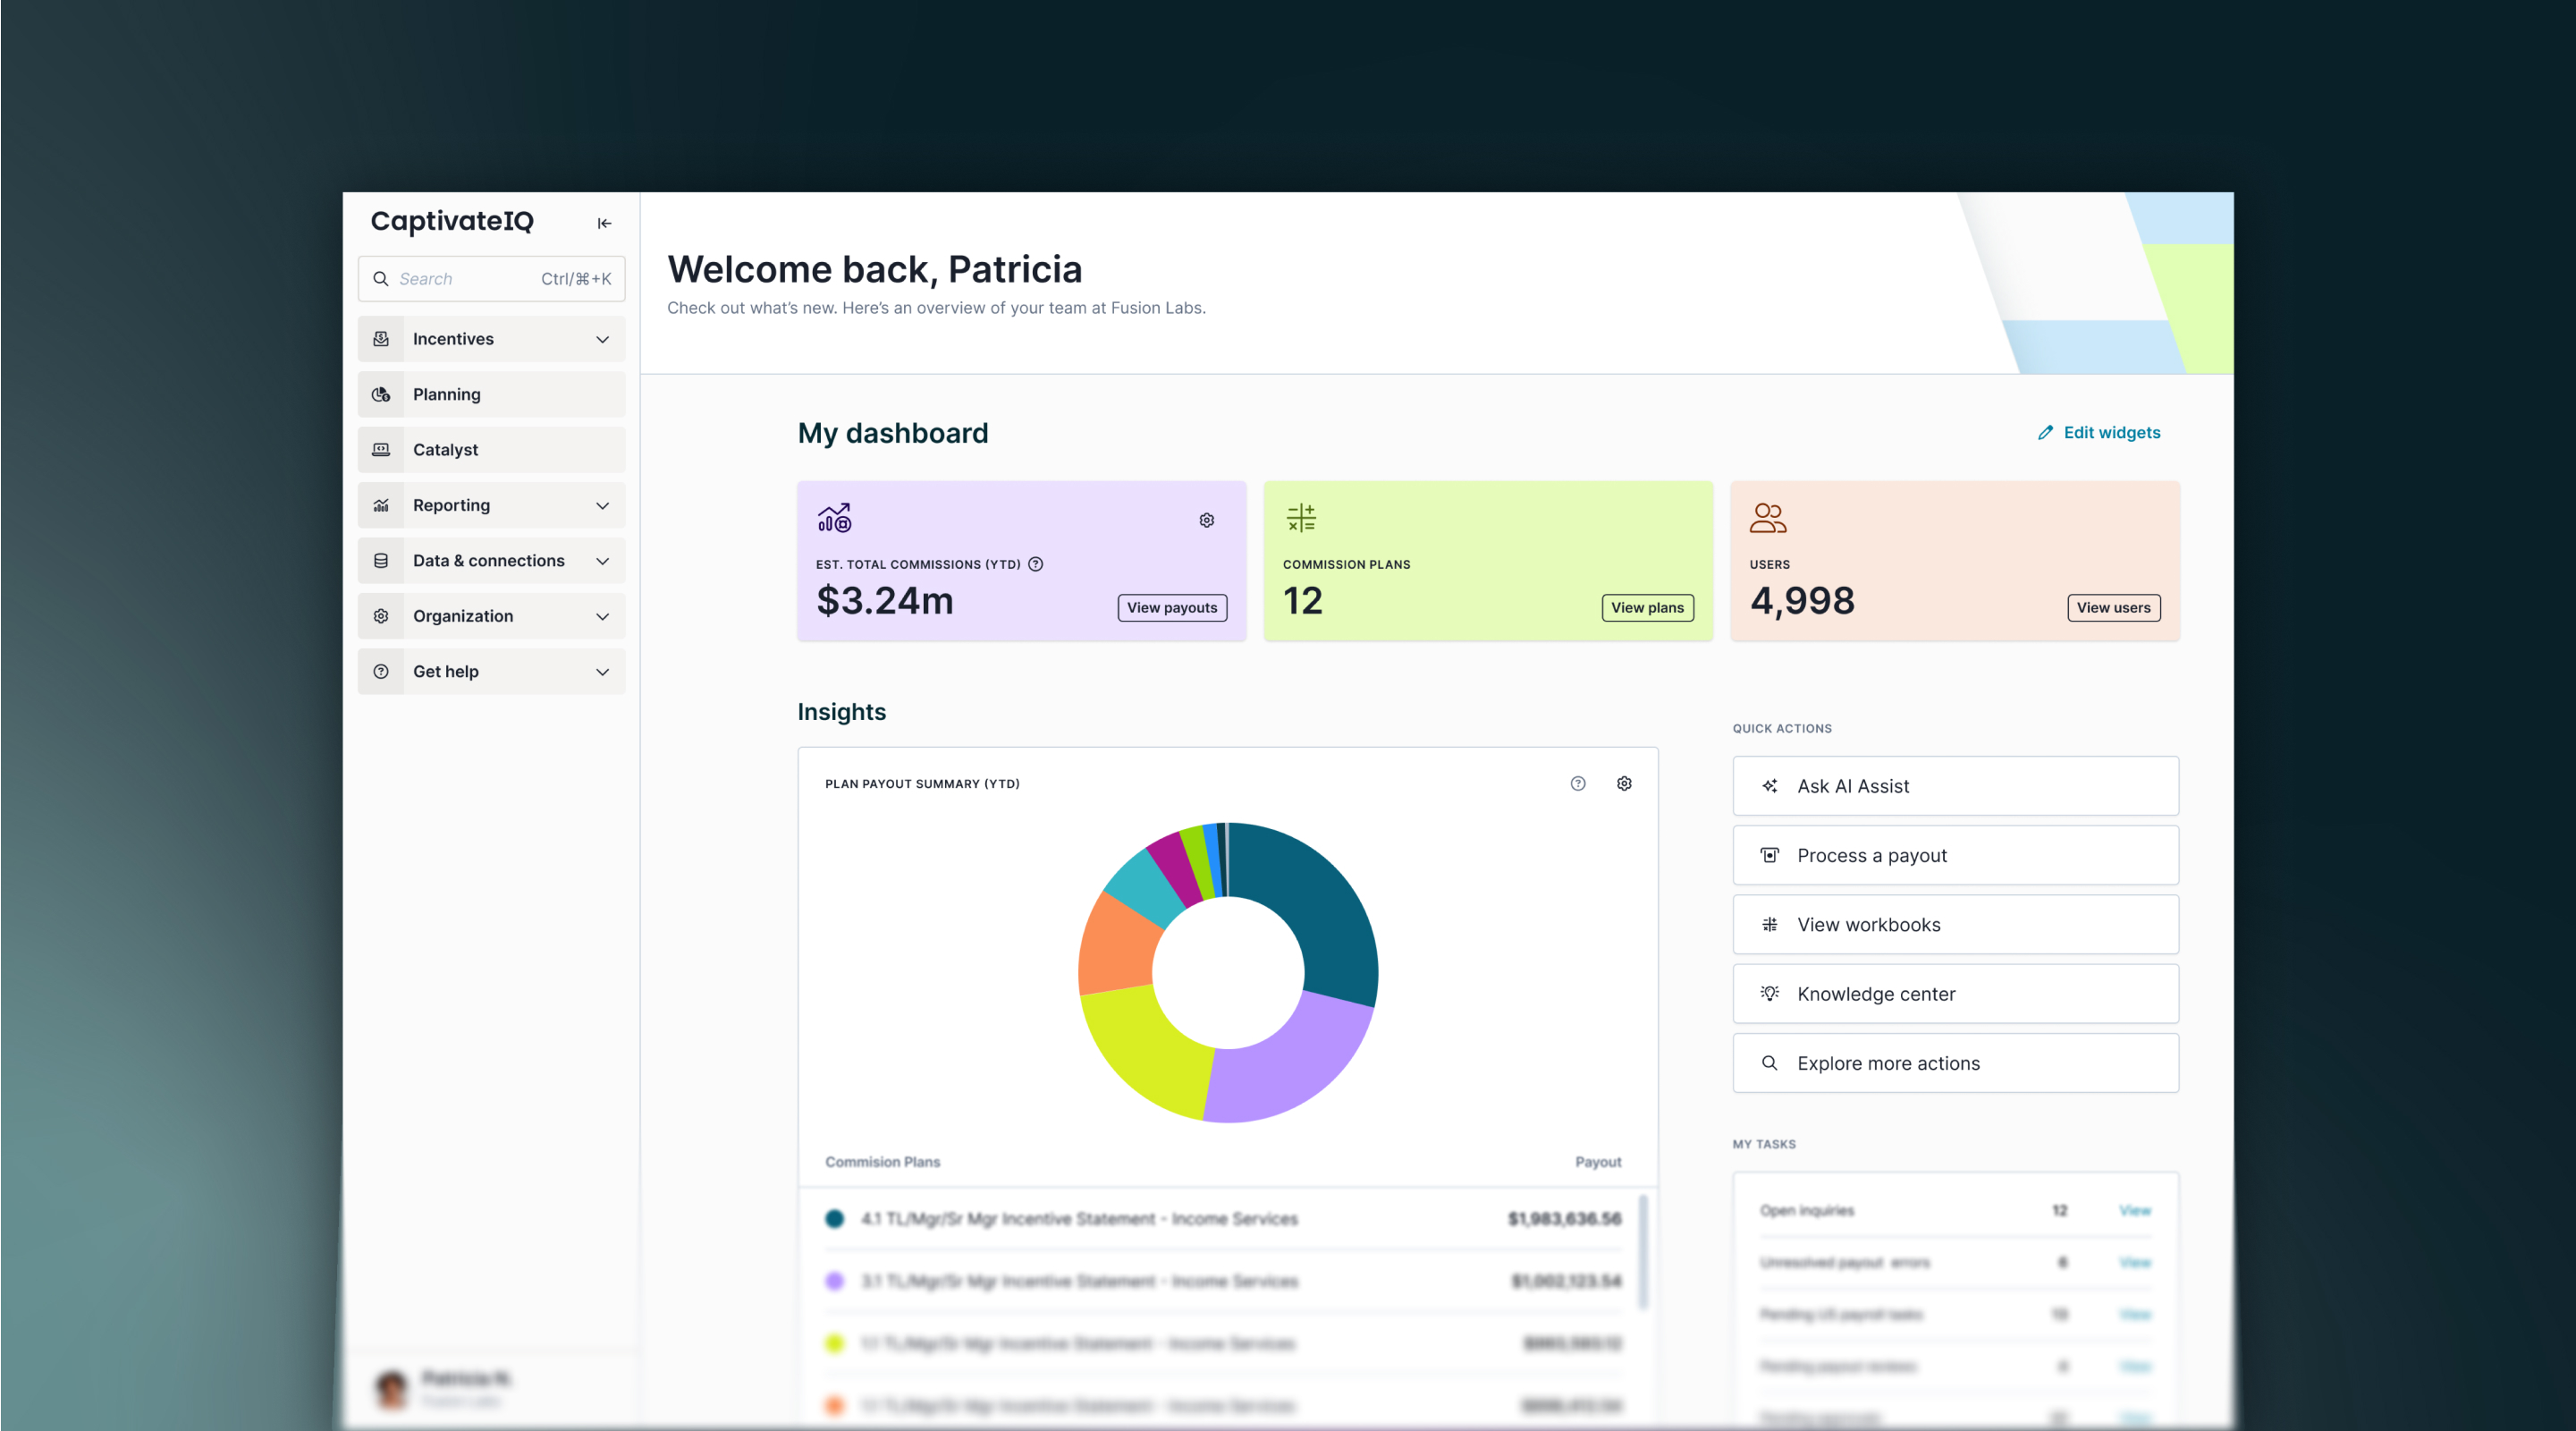
A sales compensation dashboard is a real-time view of how sellers are performing against their compensation plans and what they are earning as a result. The dashboard brings together data that normally lives fragmented across CRM systems, Excel spreadsheets, and finance systems.
For example, say a rep takes a look at their sales compensation dashboard halfway through the month. The dashboard makes it immediately clear they’re pacing just below an accelerator threshold and shows them how one additional deal could boost their payout. They are then incentivized to hit that goal.
That kind of real-time insight sets a sales compensation dashboard apart from other reporting tools. Static compensation reports, for example, typically show results only after the pay period closes. At that point, payouts are already locked, and there’s nothing left to influence.
Other tools, like general business intelligence dashboards, offer broader performance views. However, they usually stop short of reflecting the specific rules and thresholds that determine how compensation is earned. So, a BI report may show closed revenue, but it won’t reflect how adjustments, clawbacks, or crediting rules affect what a rep actually gets paid.
Sales Compensation Dashboards vs. Compensation Analytics
Sales compensation dashboards and compensation analytics serve different roles, even though they’re often grouped together.
A sales compensation dashboard is built for visibility. It shows reps, managers, and operators where performance and earnings stand right now. Metrics like quota progress and projected commissions update continuously. That makes dashboards ideal for day-to-day decision-making.
Compensation analytics, on the other hand, are designed for deeper insight. Analytics help teams look backward and forward. You use compensation analytics to analyze trends, compare performance across roles or segments, and model how changes to plans, quotas, or accelerators would impact payouts and cost of sales.
The two work best together. Dashboards create a shared, real-time understanding of compensation, while analytics build on that foundation to improve plan design, forecasting, and long-term strategy.
Why Sales Compensation Dashboards Matter
Sales compensation dashboards matter because they show teams exactly how performance turns into pay. With real-time visibility into earnings and attainment, reps know where they stand, managers coach with current data, and RevOps and Finance can validate payouts and forecasts with confidence.
Transparency Builds Rep Trust
When reps can see how their earnings are calculated and how they are progressing against quota, confidence goes up and second-guessing goes down.
Clear, real-time dashboards give reps visibility into commissions, bonuses, and attainment without waiting for end-of-month statements. Instead of debating whether a number is right, reps and comp teams can look at the same dashboard, walk through the deals, rules, or adjustments behind it, and resolve questions quickly.
“I love that I can see my compensation calculations up front, with a clear breakdown I can compare to my own tracking,” said Darren S., an account executive. “It’s easy to audit concerns and have a real conversation with ops about what’s missing.”
Faster, More Confident Decisions
Without a centralized dashboard, RevOps must often pull multiple reports, reconcile data between spreadsheets, and wait for answers from other teams.
Sales compensation dashboards remove the need for manual reconciliation. Leaders can quickly assess team performance, territory health, and commission spend, then take action before small issues turn into quarter-end problems.

Fewer Disputes and Payout Surprises
Disputes over payouts usually happen when compensation numbers appear late or without context. Dashboards reduce surprises by showing earnings as they accrue, tied to specific rules, like accelerators kicking in after quota or higher commission rates on certain products.
When reps and managers can track commissions throughout the pay period, payout conversations become confirmations instead of corrections. For compensation teams, that means fewer tickets, fewer manual audits, and smoother payroll cycles. Sales managers can spend more time coaching seller performance and less time reconciling numbers.
“We went from spending days calculating and sending statements to spending just a few hours,” said Jeff M., Head of Finance at Harness. “Commission calculations now happen in seconds.”
Better Alignment Across Sales, Finance, and RevOps
Sales compensation dashboards give everyone a shared view of the same compensation data.
A manager might open the dashboard in a one-on-one to discuss pacing with a rep. That same dashboard helps RevOps flag an unexpected dip in projected earnings, while Finance uses it to track commission expenses and answer revenue questions they have ahead of close.
“The flexibility to report on the data used in calculations has built transparency and confidence in what our reps are being paid,” said Laura H., an analytics manager, in a G2 review.
Sales compensation dashboards help teams move faster and spend more time focused on performance instead of reconciliation.

Common Use Cases for Sales Compensation Dashboards
Sales compensation dashboards reuse the same data in different ways to support revenue and operations roles.
When a rep closes a deal, they can immediately see in the dashboard how it affects their commission and quota progress. A manager looking at the same dashboard can see whether that rep is on pace for the month, which will help guide their weekly one-on-one with the rep. Finance will also use that same data to understand how much commission they will pay out to the rep.
Below are the most common use cases for sales compensation dashboards.
Self-Serve Visibility for Reps
For reps, the primary use case is visibility.
A sales compensation dashboard gives sellers real-time visibility into quota progress, earned commissions, and projected payouts. Instead of waiting for end-of-period statements or manually recalculating earnings, reps can see how each deal contributes to their pay as it happens.
This self-serve access reduces shadow accounting, increases confidence in payouts, and helps reps make informed decisions about where to focus their efforts to maximize earnings.
Performance Reviews for Sales Managers
Sales managers use compensation dashboards to support coaching and performance conversations.
Dashboards make it easy to review attainment, pacing, and earnings trends during one-on-ones and team reviews. Managers can quickly spot who is ahead or behind, identify patterns across territories or segments, and connect performance outcomes directly back to incentive design.
Because the data is current and consistent, performance reviews shift from debating numbers to discussing actions and improvement.
Plan Validation for RevOps
For RevOps and compensation owners, dashboards are a validation tool.
They help confirm that compensation plans are working as intended by showing how rules, accelerators, and thresholds play out in practice. Dashboards also surface anomalies early, such as unexpected payout spikes or missing credits.
Payout Accuracy and Forecasting for Finance
Finance teams rely on compensation dashboards for payroll accuracy.
Dashboards provide visibility into earned and projected commissions, helping finance forecast incentive expenses and close the books with greater confidence. They also make it easier to audit payouts by tracing earnings back to specific transactions.
Key Metrics Every Sales Compensation Dashboard Should Track
Metrics that show whether reps are pacing toward quota, how current performance is translating into commissions, and where earnings may spike or fall short before payroll runs matter most.
Improving performance across these metrics has a direct business impact because issues surface while there’s still time to respond. Clear signals around pacing and payouts help reps stay aligned with incentives, give managers earlier opportunities to course-correct, and allow Finance to plan and close with greater confidence, all while ensuring compensation spend supports the behaviors the business is trying to drive.
Quota Attainment
Quota attainment is the foundation of any sales compensation dashboard because it tells sellers, Finance, and RevOps whether the team is on track or not. It shows how close each rep or team is to their target and directly ties performance to incentive outcomes.
Reps can use this data to self-assess progress and adjust behavior before it’s too late in the sales period. They might, for example, prioritize late-stage deals or focus on higher-value opportunities.
For managers, attainment trends highlight who on their team could use more coaching and support. If a rep’s attainment stalls early in the quarter, it’s often a sign of thin pipeline or stuck deals, giving managers a chance to step in before targets slip out of reach. A rep who spikes late in the quarter may benefit from help with prioritization or ideas on how to qualify leads better.
Earned vs. Projected Commissions
Earned commissions show what a rep has already locked in based on closed and credited deals. Projected commissions estimate what they are on track to earn if current performance continues.
Reps can quickly see how today’s performance will affect future pay, which can motivate them to push deals through. Meanwhile, finance and RevOps can better anticipate commission expenses before payroll closes, so there aren’t last-minute surprises on the balance sheet.
Adjustments and Clawbacks
Adjustments and clawbacks are often where trust between reps and sales leaders breaks down if they are not clearly visible. A rep may see their commission reduced weeks later if, for example, a customer cancels within 90 days and the plan includes a churn-based clawback. Without clear context, it feels like money is being taken away.
A strong compensation dashboard shows credits, debits, reversals, and manual adjustments alongside the original transactions that caused those actions. This context helps reps understand why their earnings changed and reduces back-and-forth between them and managers at payout time.
Performance vs. Plan
Performance vs. plan shows whether additional sales will meaningfully change a rep’s pay. Based on the rules of the compensation plan.
This metric helps sellers understand how much more they can earn given their current pace. For RevOps, it can show how well their compensation plan is working. If RevOps sees sellers stalling out just below a payout bump, that threshold may be too hard to reach. If reps are blowing past it, the plan may be too generous.
Time-Based Trends
Time-based trends are another way of looking at compensation metrics within your sales dashboard. So, instead of seeing commission earnings at the current moment, you can switch to a view that shows a rep’s earnings over time.
That can be helpful for spotting pacing patterns. Does a rep build earnings steadily throughout the month, or do they rely on a late surge of deals at the end?
If the latter, a manager can sit down with the rep to understand what is happening earlier in the cycle. Maybe they have a thin early-stage pipeline, or there is a specific reason deals are stalling mid-funnel.
Individual vs. Team Views
Compensation dashboards should support both individual and team-level views: While individual views help reps understand their own performance and earnings in detail, team-level views help managers compare attainment, identify outliers, and assess overall incentive costs.
The ability to move easily between these perspectives ensures everyone, from sellers to executives, is working from the same data.
How to Build Effective Sales Compensation Dashboards
An effective sales compensation dashboard starts with clarity around who needs the dashboard, what decisions it should support, and how compensation data connects back to performance. Without that clarity, dashboards quickly turn into collections of charts that look useful but don’t actually change behavior or decisions.
The steps below outline how to build a sales compensation dashboard that teams will actually use.
Start With the Role
The first step of building an effective sales compensation dashboard is defining the audience and purpose.
For example, a rep-facing dashboard should answer, “How am I tracking against quota, and what will I earn if I keep this pace?”
A manager dashboard, on the other hand, needs to support coaching and performance reviews. In practice, that means showing how each rep is pacing against quota, where deals are stalling, and how close sellers are to key earning thresholds.
Meanwhile, RevOps and Finance dashboards focus on plan validation, payout accuracy, and forecasting.
In CaptivateIQ, you can build multiple dashboards off the same underlying compensation data, tailoring views and permissions by role without duplicating logic or reports.
Highlight the Most Impactful Metrics
Next, choose metrics that directly tie performance to pay.
This typically means quota attainment, earned and projected commissions, progress toward accelerators or bonuses, and any adjustments or clawbacks that affect earnings.
Supporting context like performance versus plan rules or team-level rollups can add depth, but the headline metrics should always answer one question: “How is performance translating into compensation?”
CaptivateIQ makes it easy to surface these metrics consistently across reps, teams, and time periods, so everyone is working from the same numbers.
Connect Performance to Earnings Outcomes
A compensation dashboard should make the relationship between performance and earnings easy to see in real time. To do that, you need to put data that shows quota progress, deal outcomes, and commissions onto one screen within the dashboard. That way, reps can see the impact of their performance on their pay without jumping between reports.
With CaptivateIQ, compensation dashboards pull directly from CRM and source systems, ensuring that performance data and commission calculations stay in sync.
Build Time-Based and Comparative Views
Strong dashboards help you see patterns and trends at a glance.
You can set up your dashboard to do this by offering time-based views and comparative views.
A time-based view will pull in the data from the last week, month, quarter, or even year and plot it on a chart.
A comparative view will pull data from different sellers or teams and show you that data side-by-side.
CaptivateIQ dashboards support flexible time filters and comparison views, making it easy to spot patterns, outliers, and risk early without creating separate reports or exporting data.
Make the Data Traceable and Auditable
Dashboards should allow users to click into the underlying data, review which deals were credited, see when adjustments were applied, and understand how plan rules affected the final compensation.
Without a dedicated compensation platform, teams usually try to recreate this level of transparency in a spreadsheet. They pull deal data from the CRM and apply commission formulas for accelerators and clawbacks. Users can still trace their way back to the original data source, but it’s manual, slow, fragile, and hard to maintain.
In CaptivateIQ, users can simply click on the dashboard metrics to see the source data and the commission formulas.
Iterate as Plans and Priorities Change
Sales compensation dashboards are not set-and-forget.
As plans evolve, new incentives launch, or business priorities shift, dashboards should evolve with them. The best teams treat dashboards as living tools, refining metrics, views, and thresholds as they learn what drives behavior and results.
For example, a company might launch a mid-quarter SPIFF to accelerate pipeline. When that happens, dashboards need to show new information like progress toward the SPIFF target and eligibility for the bonus.
CaptivateIQ’s no-code dashboarding and reporting capabilities make it easy to adjust without rebuilding spreadsheets or relying on engineering support.
Turn Dashboard Visibility Into Action
Sales compensation dashboards create visibility. More visibility allows reps to take action sooner.
Once teams have a shared, real-time dashboard view of attainment and earnings, they can analyze trends, validate plan effectiveness, and forecast commission expenses.
CaptivateIQ’s dashboards provide a single source of truth for compensation visibility. Our reporting and analytics tools help teams dig deeper, test scenarios, and continuously optimize incentive programs without relying on spreadsheets and one-off reports.
Want to explore how CaptivateIQ’s reporting suite can help you drive informed decision-making for your business? Take a product tour!


%20Tools%20For%202026_1200x630.png)