.svg)

What's New at CIQ: June 2026

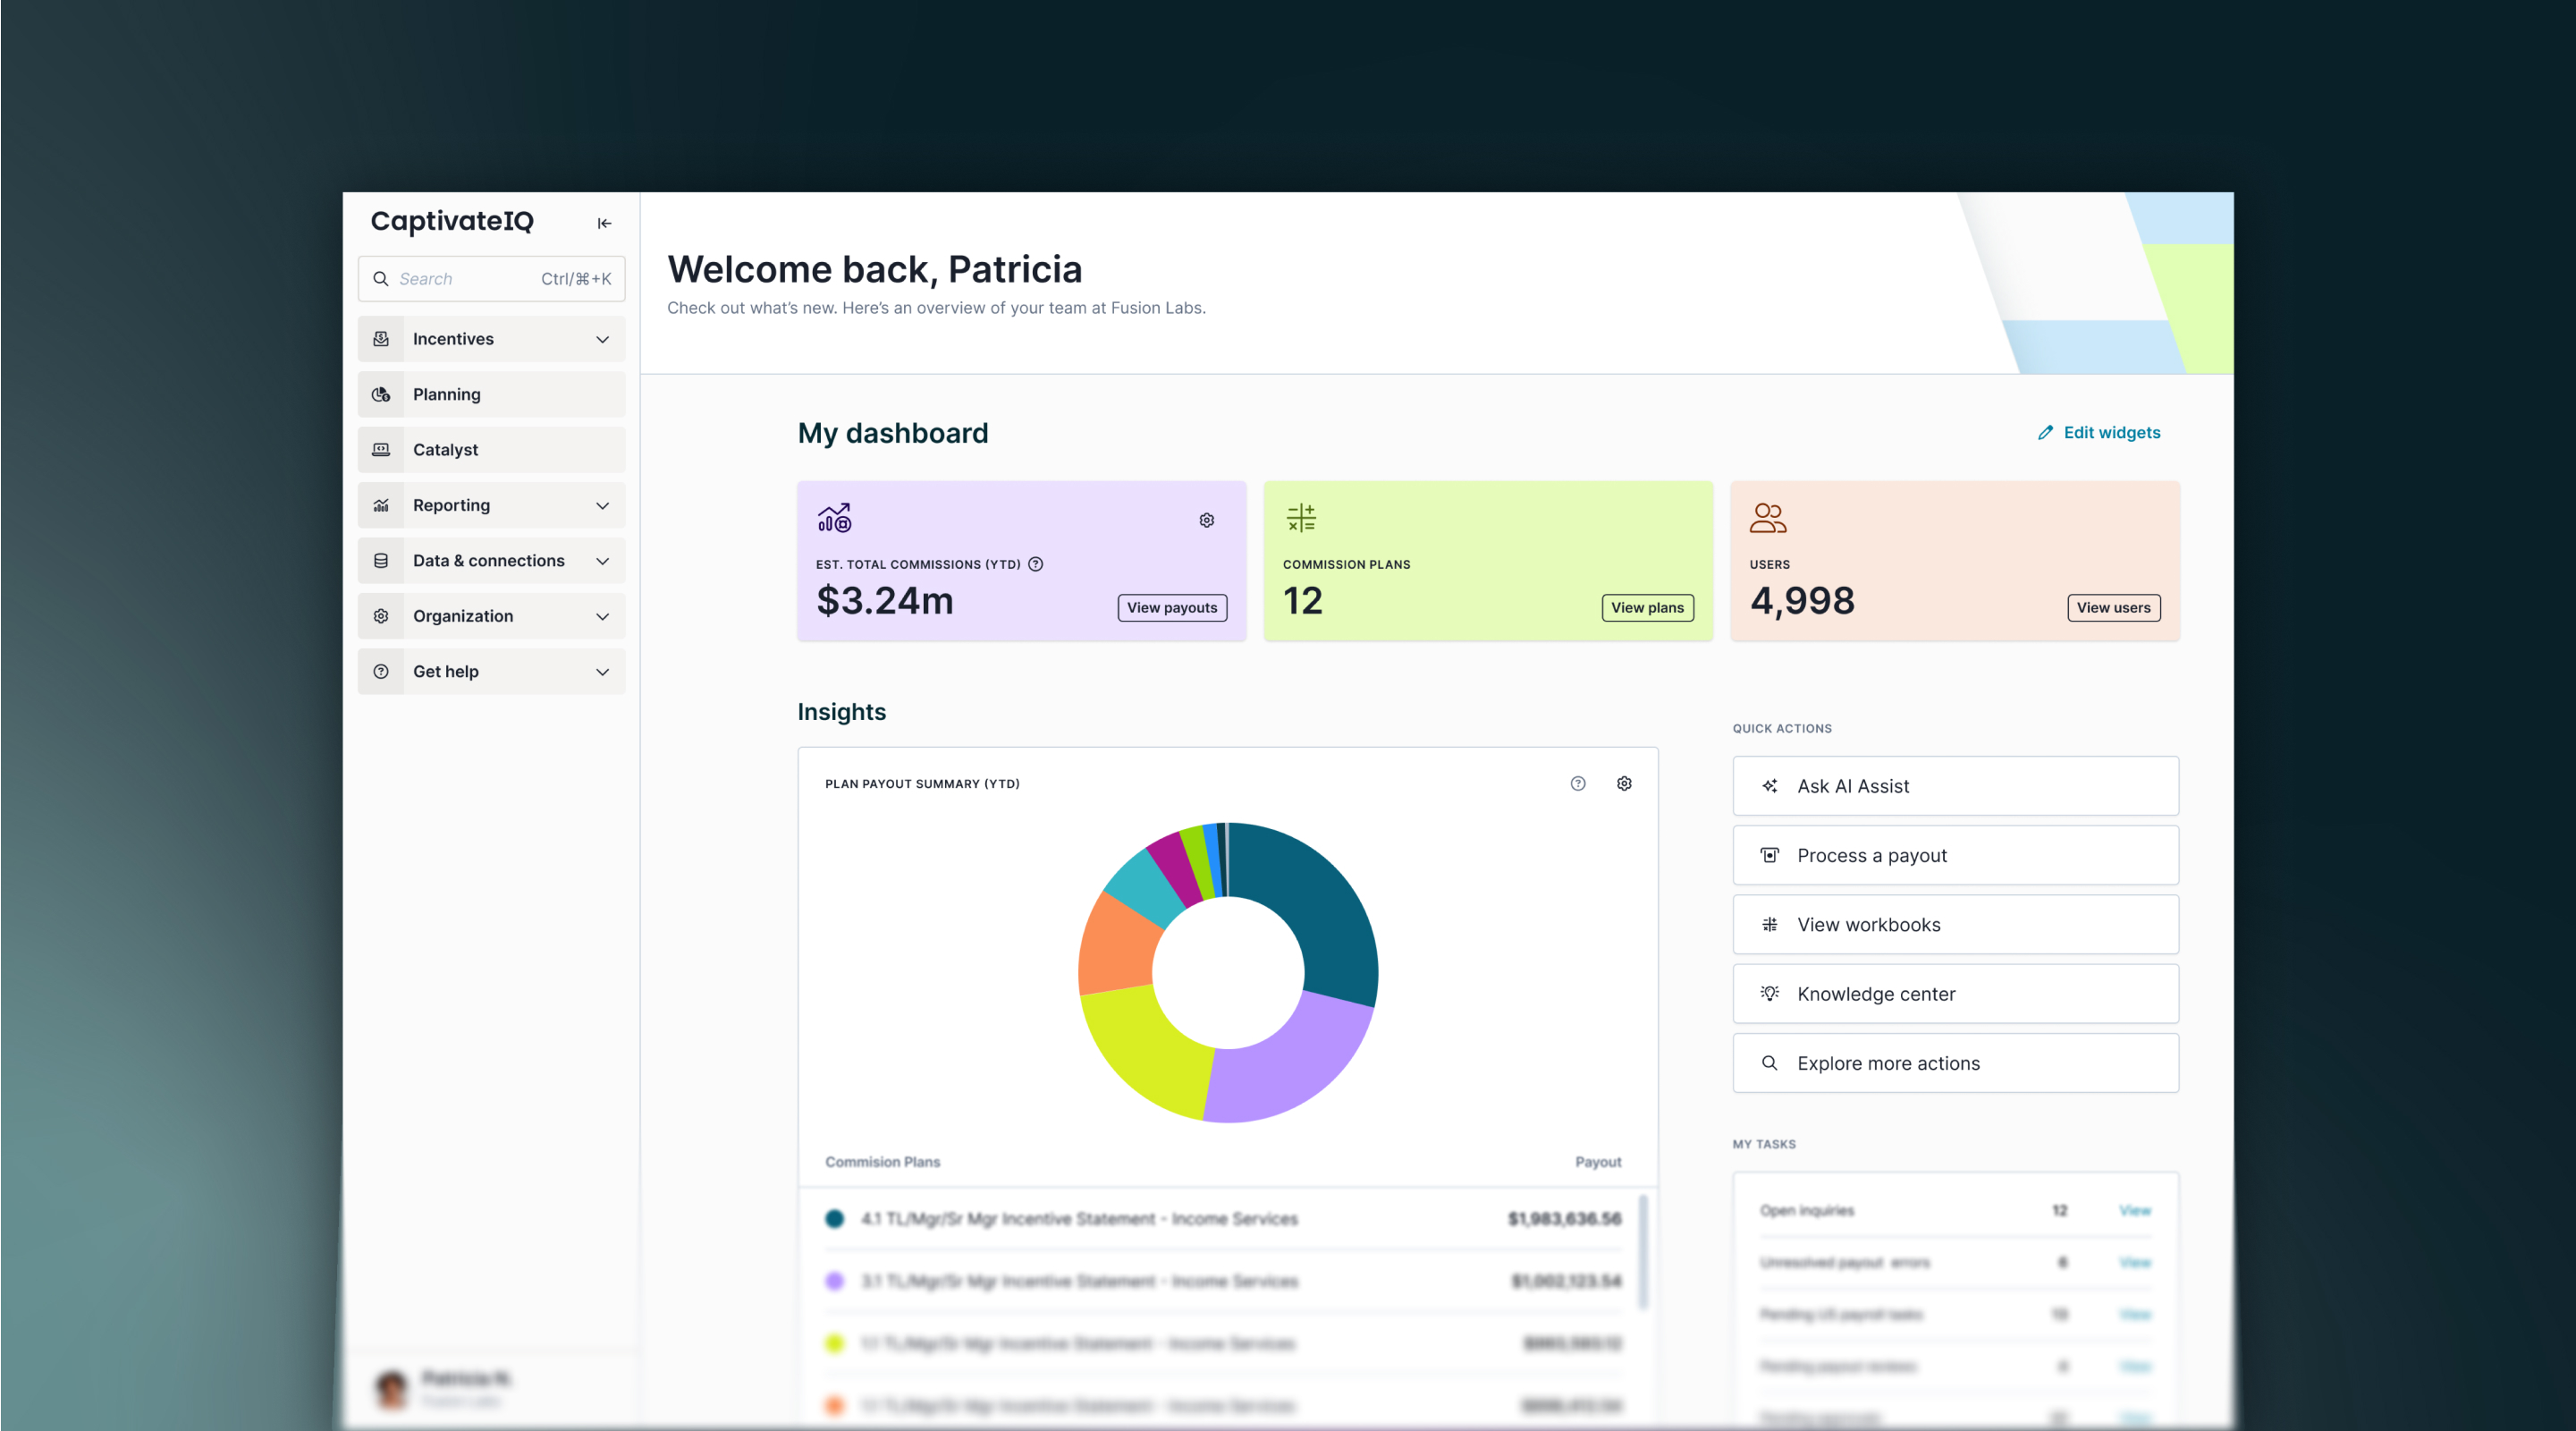
CaptivateIQ Incentives
CaptivateIQ Agents
CaptivateIQ is launching a portfolio of AI agents built for the compensation and planning lifecycle. Three agents are now part of the platform, each purpose-built for a distinct set of workflows: the Comp Builder Agent, the Comp Ops Agent, and the Rev Planning Agent.
Comp Builder Agent
The Comp Builder Agent creates compensation plans from your existing data and structure. Instead of starting from scratch or replicating plans manually, the agent works from the information already in CaptivateIQ to build plans at the speed of intent.
Comp Ops Agent
The Comp Ops Agent runs compensation workflows without the manual work. Teams can use it to handle operational tasks that would otherwise require manual coordination, keeping compensation workflows running without relying on back-and-forth between admins and reps.
Rev Planning Agent (Closed Beta Starting June 17)
The Rev PlanningAgent reads and explains your sales planning model in plain language. The agent has full context across the key entities in your model, including territories, accounts, quotas, formulas, account dealer rules, and roster data. Using read-only access, the agent understands a specific customer's model configuration and answers natural language questions about it.
Representative use cases include:
- "Why does this rep have this quota?" The agent traces the formula chain and surfaces the inputs driving the output.
- "Which formulas reference this column?" The agent maps dependencies across the model.
- "What accounts are assigned to this territory, and by what rules?" The agent explains the account dealer configuration in plain language.
In this initial release, the agent operates in a read-only capacity. The agent explains the model but does not make changes to it. Beta access opens June 17. Contact your Customer Success Manager to sign up for the waitlist.
Native Plan Document Management
Teams can now create, send, route, and track plan documents directly in CaptivateIQ.
Admins build reusable templates from PDFs by marking them up with single-field variables and signature fields. CaptivateIQ generates personalized PDFs populated with CIQ Global Attributes data. Templates route to recipients, with the option to acknowledge without a signature where appropriate.
Admins can view in-flight documents, download completed documents, void or cancel documents in flight, and manage status and activity history. Payees can view in-flight documents and download completed documents. Email notifications cover key events including pending actions, completions, and voids.
Native Plan Document Management is currently in closed beta. Contact your Customer Success Manager to sign up for the waitlist.
<hr>
CaptivateIQ Planning
Approvals: Parallel Branching and Dynamic Hierarchy-Based Routing
Collaboration workflows in CaptivateIQ now support two new capabilities for teams that need more control over how approvals move through the organization.
Parallel Approvals
Parallel Branching allows multiple approvers to exist at the same level in a workflow, each operating independently on their own branch. When an approver completes their review, downstream nodes in their branch unblock immediately. The workflow does not wait for peer approvers at the same level to finish. Once all peer branches at the current level have resolved, the workflow advances to the next stage.
Dynamic Hierarchy-Based Routing
Dynamic Hierarchy-Based Routing gives admins a way to configure routing logic once in the workflow builder. The system resolves the right approver for each branch based on the hierarchy tied to the Roster. When org structures change between cycles, the routing updates automatically without requiring workflow reconfiguration.
Note: With this update, the option to reject an approval has been replaced with two options: approve or approve with changes.
Named Chart Views (Beta)
Admins can now save a chart layout as a named view and assign that view across many territory nodes at once. Pick the nodes individually or assign to an entire level of the hierarchy, like every VP node or every Manager node. When the view needs to change, edit it from one node and the system propagates the update to every node using it, with a confirmation step before the bulk update runs.
Common use cases:
- Build a VP-level dashboard view and apply it to every VP node in one action.
- Build a Manager-level view that's distinct from the VP view and apply it to every Manager node.
- Clone an existing view as a starting point for a regional or segment variant.
- Fix a chart configuration mistake once and have the correction roll out everywhere the view is used.
Contact your Customer Success Manager to opt in to the beta.
Sales Planning Enhancement
A bundle of usability improvements rolling out across Sales Planning to give admins and collaborators a more consistent, faster experience day to day.
- Roster descriptions. Admins can now add descriptions to Roster worksheets, giving collaborators context about what each worksheet is for without needing a separate doc or message.
- Automated Roster sync. Roster worksheets can now sync on an automated schedule through Workflows, so headcount and role data stay current without manual refreshes.
- Roster column filtering. Roster worksheets now support column filters, making it easier to find specific people or segments inside large rosters.
- Territory analytic chart filtering by Account. Territory analytic charts now filter by Account, so admins can isolate the accounts driving a metric without leaving the chart view.
- CSV export for Collaborators. Collaborators can now export worksheets to CSV directly. Previously this was admin-only, which created bottlenecks when sales leaders or finance partners wanted to pull data into their own tools.
- Toggle-able column totals. Individual worksheets now support a totals row that admins can toggle on. A few notes on how it works:
- The totals row is a front-end visual only. Values can't be referenced in formulas or used as inputs elsewhere.
- All numeric columns sum automatically. Percentage columns will also sum, which may not produce a meaningful number, but column-level aggregation type cannot be configured at this time.
- The totals row reflects whatever is currently visible on the screen, so filters apply to the sums.
- Collaborators can see the totals row when it's toggled on for worksheets they have access to, but only admins can toggle it on or off.
Contact your Customer Success Manager with questions about any of these enhancements.
<hr>
Catalyst
Scenario Improvements
Two updates improve how teams build and compare scenarios in Catalyst.
When creating a new scenario from a "From Scratch" worksheet, data now copies over alongside the schema. Previously, only the schema carried over, requiring teams to re-enter data manually after setup.
Scenario comparison now includes a Visualizations tab with Bar and Line charts. When working with a large number of metrics, charts give teams a faster way to compare outcomes across scenarios without parsing through dense data cards.
Forecasting Improvements
A new Simple flow reduces the steps required to set up a forecast. Users identify three columns (Date, Target, and Group On) plus a time horizon. CaptivateIQ surfaces which horizons are available based on the volume of data in the model. After running a forecast, the platform auto-generates a line chart that displays historical data alongside forecasted values.
Line charts now include confidence intervals, showing the range of values likely to contain the true outcome. Confidence intervals give teams a clearer view of uncertainty in time-series predictions. Users can also build Combo charts, plotting Line and Area on the same visualization.
Generate a Payout Forecast with Assist
Setting up a payout forecast in Catalyst previously meant creating a workspace, pulling in resources from payout data, adding a separate input for each period group, unioning those into a single historical sheet, and walking through the forecasting wizard. Assist now handles the full setup from a single prompt.
From the Machine Learning view, users click "Ask CaptivateIQ Assist" and select "Help me generate a payout forecast." Assist pulls in the available plans with payouts and shows how many periods of data each has. The user picks a plan, and Assist proposes the forecast settings: the workspace to use, the target column (defaulting to the plan's adjusted payout), the other numeric non-percentage columns to include as features, and the forecast grouping (per employee where an employee dimension exists, or as an aggregate).
Assist also flags data eligibility. If specific employees don't have enough data, Assist notes them and offers a choice between running the forecast on everyone at a capped horizon or excluding those employees to use the maximum horizon possible.
Once the user confirms, Assist creates the inputs, runs the payout union across period groups, kicks off training, and links to the resulting forecast worksheet with the confidence bands rendered.
Requires the Assist Agent Charting feature flag. Contact your Customer Success Manager to enable.
<hr>
What Catalyst Enables
With Catalyst, teams can:
- Build flexible, reusable models for a variety of planning use cases
- Run scenario comparisons to evaluate different strategic outcomes
- Forecast payouts, attainment, ARR, and usage leveraging ML-based models
- Detect anomalies or emerging performance trends
- Score accounts or reps to support coverage decisions
- Support multi-year and long-range planning with stable, auditable models
<hr>
Get Started with These New Features
To learn more about any of these features or to get implementation assistance on Beta features, please contact your Customer Success Manager.
We're committed to continuously improving our platform based on your feedback. Thank you for being part of the CaptivateIQ community!
Read more for additional information on feature releases in our Knowledge Center.
.jpg)